Building a Dedicated Observability Kiosk for My Proxmox Homelab
Introduction
Every homelab reaches a point where the hard part is no longer getting another service running. The hard part is knowing, at a glance, what state the whole environment is in.
That was the point I reached while moving from a simple Proxmox server to a more complete lab built around a Minisforum MS-01 running Proxmox VE, OPNsense, Grafana, Loki, Prometheus, UniFi, Proxmox Backup Server, and a growing set of Linux virtual machines.
Nothing was especially mysterious on its own. The firewall had its own interface. Proxmox had its own interface. UniFi had its own interface. PBS had its own interface. Logs and metrics existed, but they lived in too many places. I kept opening browser tabs to answer basic operational questions: is the hypervisor healthy, are the backups succeeding, is the internet connection stable, did a VM stop overnight, what caused that CPU spike, what did the firewall block while I was asleep?
The information was there. The problem was that it was fragmented.
The answer was not simply to build another dashboard and leave it buried in a browser tab. I wanted a dedicated observability appliance: a small rack-mounted screen that continuously shows the operational state of the lab without needing a laptop, a login, or a round of clicking through separate tools.
The result is a 9-inch rack display driven by a Raspberry Pi 5. It shows Grafana dashboards backed by Prometheus and Loki, and it works more like a small Network Operations Centre than a normal web page. This post documents the hardware, software, architecture, and dashboard structure behind that setup.
The Infrastructure Being Monitored
The observability platform monitors a virtualised environment running on a Minisforum MS-01. The MS-01 is the primary Proxmox host and carries most of the core lab services: OPNsense, UniFi, PBS, GRAFANA, PULSE, Linux infrastructure VMs, security tooling, and test or training environments.
The network is segmented with VLANs and routed through OPNsense, so the kiosk is not really watching a single machine. It is watching a small infrastructure stack: compute, storage, networking, backups, logs, metrics, and the services that sit between them.
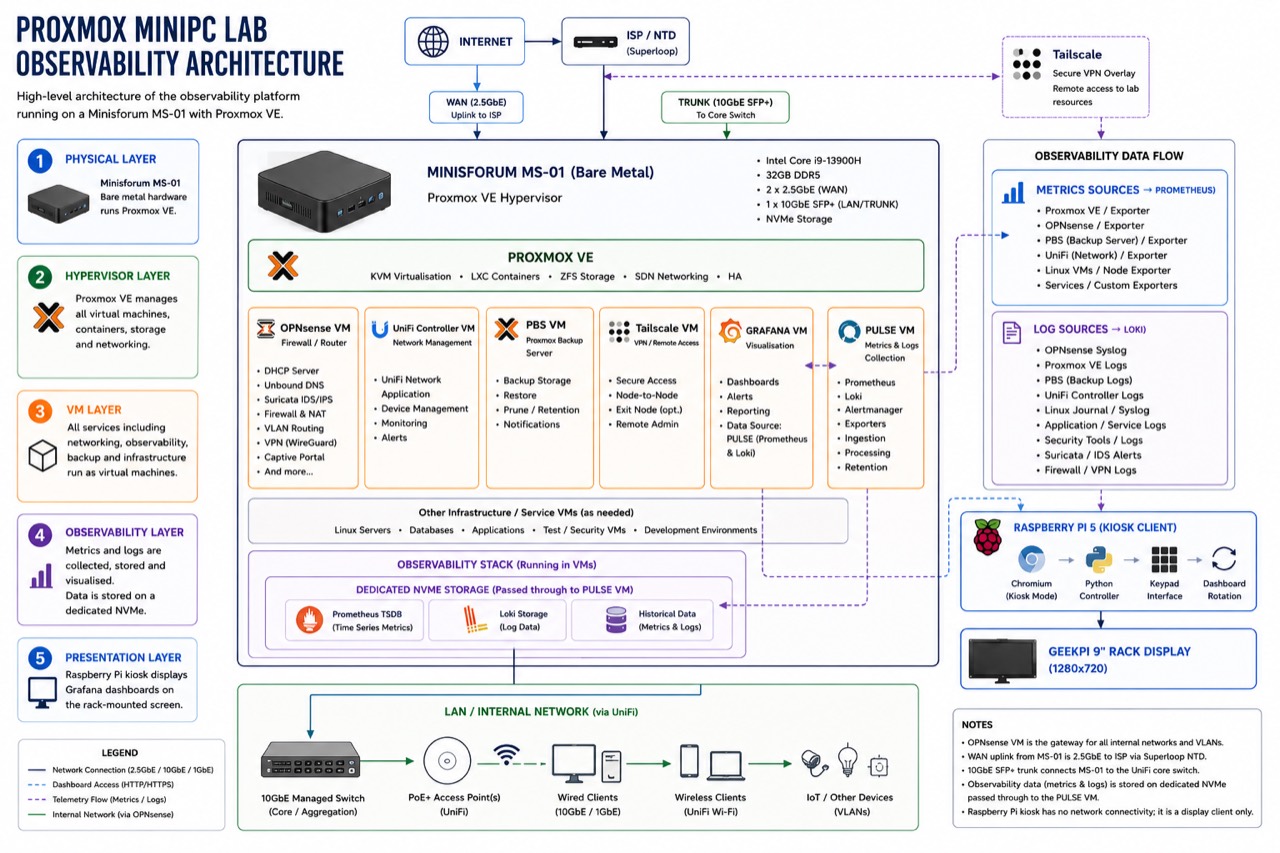
Figure 1: The full picture: the Minisforum MS-01 bare-metal host, the Proxmox VE hypervisor, the VM layer (OPNsense, UniFi, PBS, Tailscale, GRAFANA, PULSE), the dedicated NVMe observability storage, and the Raspberry Pi kiosk presentation layer.
Design Philosophy
The design goal was simple: make the state of the lab visible without turning the display client into another critical system.
The first principle was visibility without interaction. Useful monitoring should not always require opening a laptop, authenticating, and navigating a UI. If I walk past the rack, I should be able to tell whether the lab is healthy.
The second principle was separation of concerns. The display should display, the collection layer should collect, the visualisation layer should visualise, and storage should be treated as its own workload. Keeping those roles separate makes the system easier to troubleshoot and less fragile when one component has a problem.
The third principle was making the kiosk disposable. The Raspberry Pi should not hold important state. If it fails, the observability platform should keep collecting and storing telemetry. Replacing the display client should be annoying, not catastrophic.
Hardware
Raspberry Pi Display Client
The display client is a Raspberry Pi 5 with 8GB of RAM and the official active cooler. It boots from a microSD card and runs Raspberry Pi OS.
I deliberately avoided adding SSD storage to the Pi. In this design, the Pi does not collect metrics, store logs, run databases, or process telemetry. It runs Chromium, runs a small Python controller, and displays Grafana dashboards. That workload is light enough that adding more storage would mostly add complexity.
| Component | Specification |
|---|---|
| Platform | Raspberry Pi 5 |
| Memory | 8GB LPDDR4X |
| Cooling | Raspberry Pi Active Cooler |
| Storage | microSD Card |
| Operating System | Raspberry Pi OS |
| Browser | Chromium |
| Purpose | Dashboard display client |
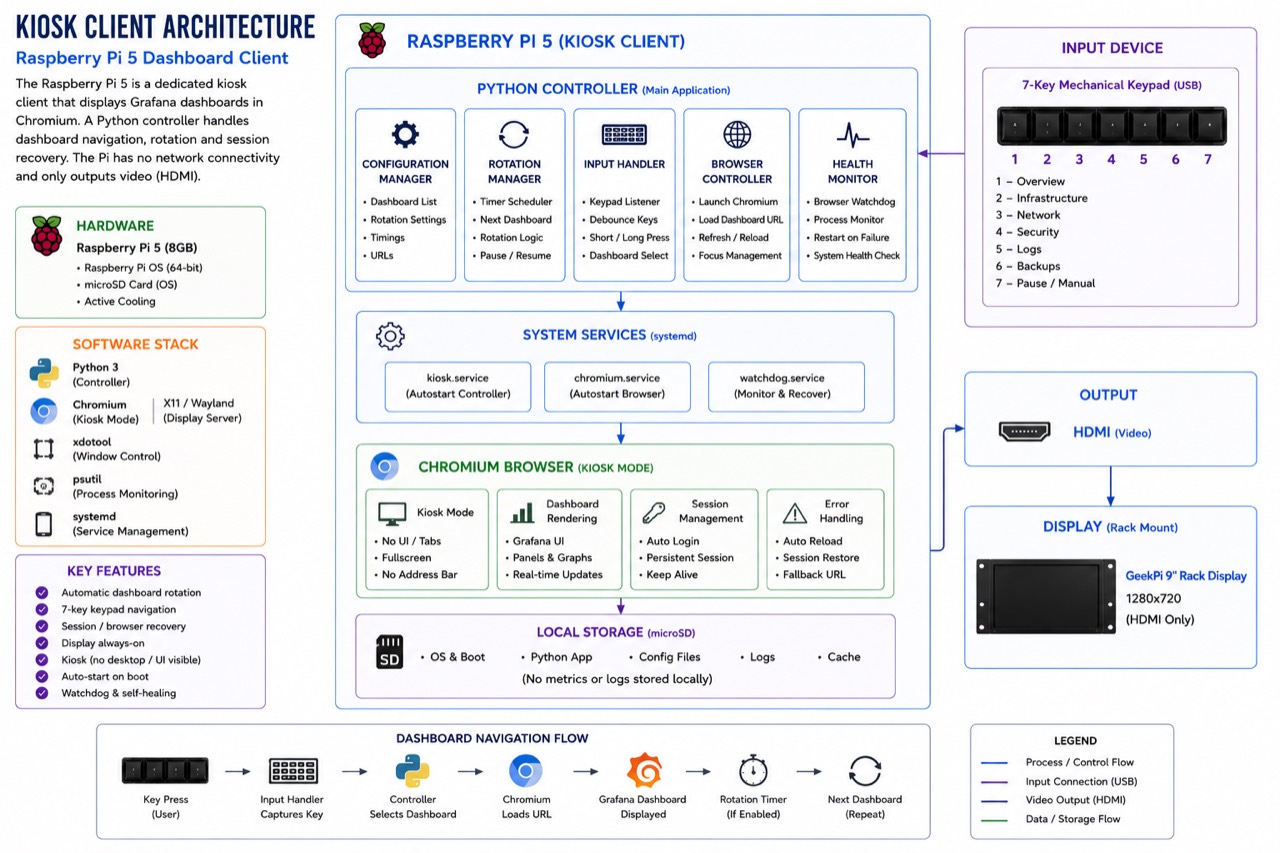
Figure 2: The kiosk client internals. A Python controller manages dashboard navigation, rotation and session recovery; Chromium runs full-screen in kiosk mode; the Pi has no network path to the monitored systems and only outputs video.
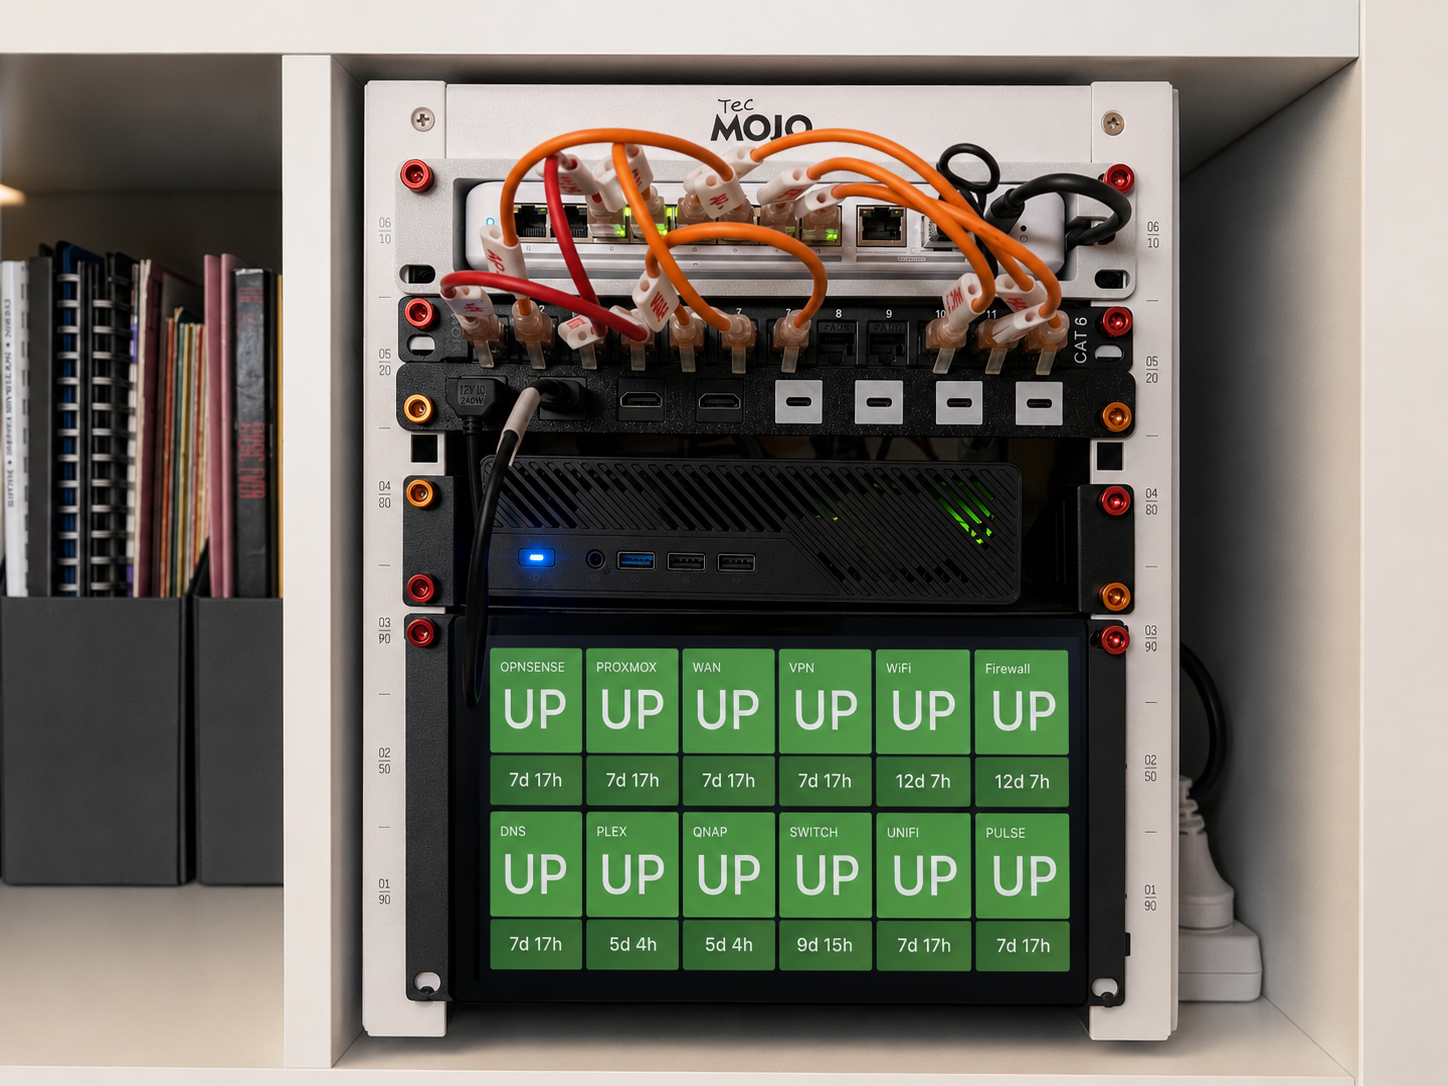
Rack-Mounted Touchscreen
The display is a GeekPi 9-inch rack-mounted touchscreen. It occupies 3U of rack space and connects over HDMI, with USB used for touch input.
| Component | Specification |
|---|---|
| Manufacturer | GeekPi |
| Display Size | 9-inch |
| Resolution | 1280 x 720 |
| Touch Technology | Capacitive touch |
| Rack Height | 3U |
| Interface | HDMI + USB touch |
The practical difference between this and a desk monitor is surprisingly large. Once the screen is mounted in the rack, observability becomes part of the infrastructure rather than something I remember to open. The rack itself shows whether the environment is behaving.
Dashboard Control Keypad
Beneath the screen is a programmable seven-key mechanical USB keypad. Each key maps to a specific dashboard, so switching views does not require a mouse, keyboard, or reaching for a browser address bar.
That small detail changes the feel of the system. It stops behaving like a general-purpose computer and starts behaving like a dedicated operational panel.
Architecture
The observability platform is split into three layers: presentation, visualisation, and collection.
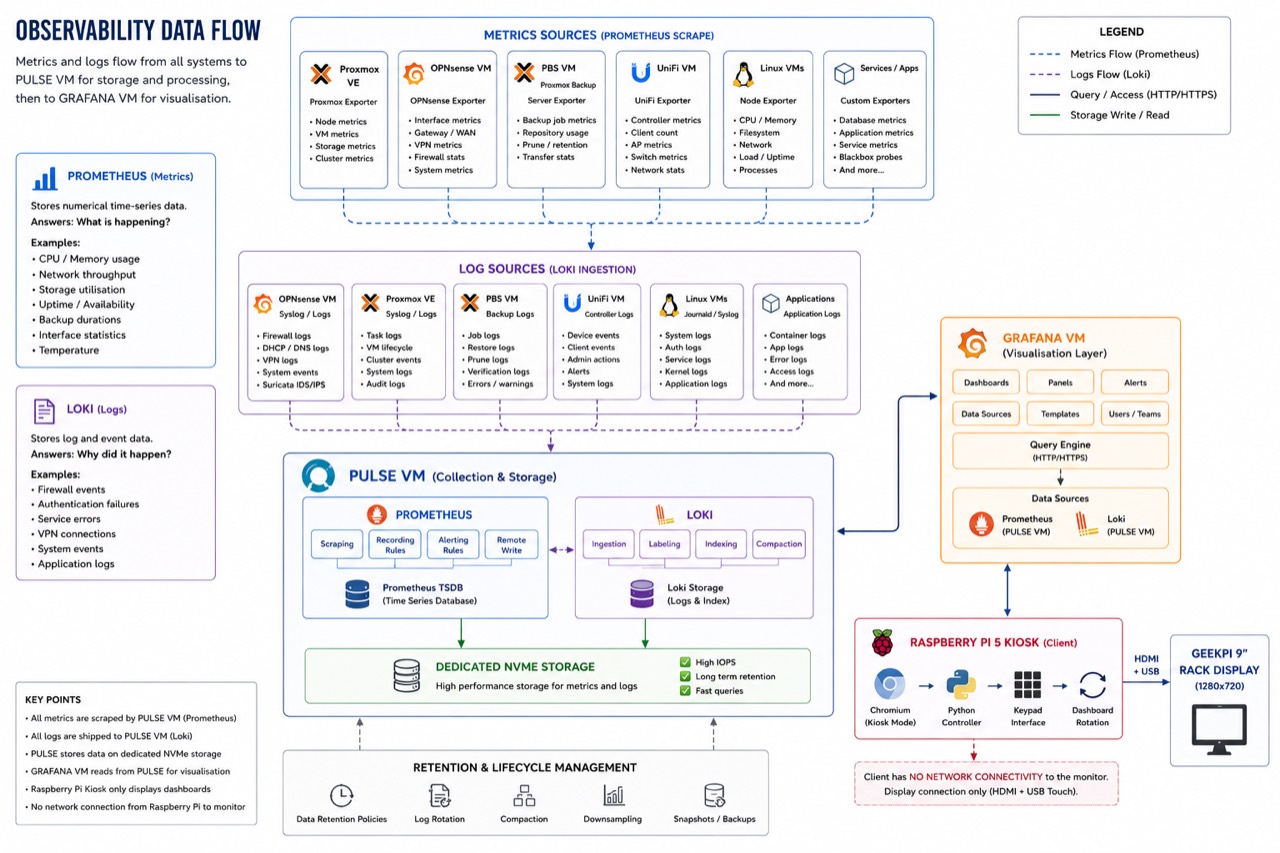
Figure 3: How data moves. All metrics are scraped by Prometheus and all logs are shipped to Loki, both running on the PULSE VM and stored on dedicated NVMe. GRAFANA queries PULSE; the kiosk simply renders the result.
The presentation layer is the Raspberry Pi, Chromium, and the Python control software. It displays dashboards, handles dashboard switching, and rotates between views. It does not store logs or metrics.
The visualisation layer is the GRAFANA VM. Grafana renders dashboards, presents alerts, manages access, and queries the data sources. It is responsible for making telemetry readable, but it is not responsible for collecting it.
The collection layer is the PULSE VM. This is where Prometheus and Loki live, and where metrics, logs, time-series data, and telemetry processing are handled. In this architecture, GRAFANA is the face of the platform and PULSE is the engine room.
Both GRAFANA and PULSE run as dedicated virtual machines on the Minisforum MS-01 Proxmox host. That keeps them easy to snapshot, back up, isolate, and migrate.
MS-01 Physical Host
├── OPNsense VM
├── UniFi VM
├── PBS VM (Proxmox Backup Server)
├── Tailscale VM
├── GRAFANA VM
├── PULSE VM
├── Linux Infrastructure VMs
└── Security/Test VMs
The Raspberry Pi sits outside that hierarchy. If the Pi fails, collection continues. If Grafana fails, collection continues. If PULSE fails, the display may keep running but no longer has fresh telemetry to query. Each layer can fail without immediately dragging the others with it.
Dedicated NVMe Storage
One of the more important choices was separating observability data from operating system storage.
Prometheus and Loki produce constant write activity. Metrics are recorded, logs are ingested, indexes are updated, retention policies are applied, and historical telemetry grows over time. In a small lab it is easy to underestimate this, but observability can become one of the busiest storage workloads in the environment.
For that reason, Prometheus databases, Loki storage, historical metrics, and historical logs all live on a dedicated NVMe volume. That keeps telemetry from competing with normal VM operating system activity, makes backup policy easier to reason about, and gives retention room to grow without redesigning the whole storage layout.
Understanding the Data Sources
The kiosk relies on two main kinds of telemetry.
Prometheus stores numerical time-series metrics: CPU usage, memory usage, storage consumption, network throughput, uptime, temperatures, backup durations, and similar measurements. In practical terms, Prometheus answers the question: what is happening?
Loki stores logs: firewall events, authentication failures, service crashes, VPN activity, application errors, and system events. Loki answers a different question: why did it happen?
The value comes from having both. Metrics show state, logs provide context.
The Dashboards
The Grafana dashboards are organised by function. Each dashboard answers a specific operational question and uses the right mix of Prometheus metrics and Loki logs.
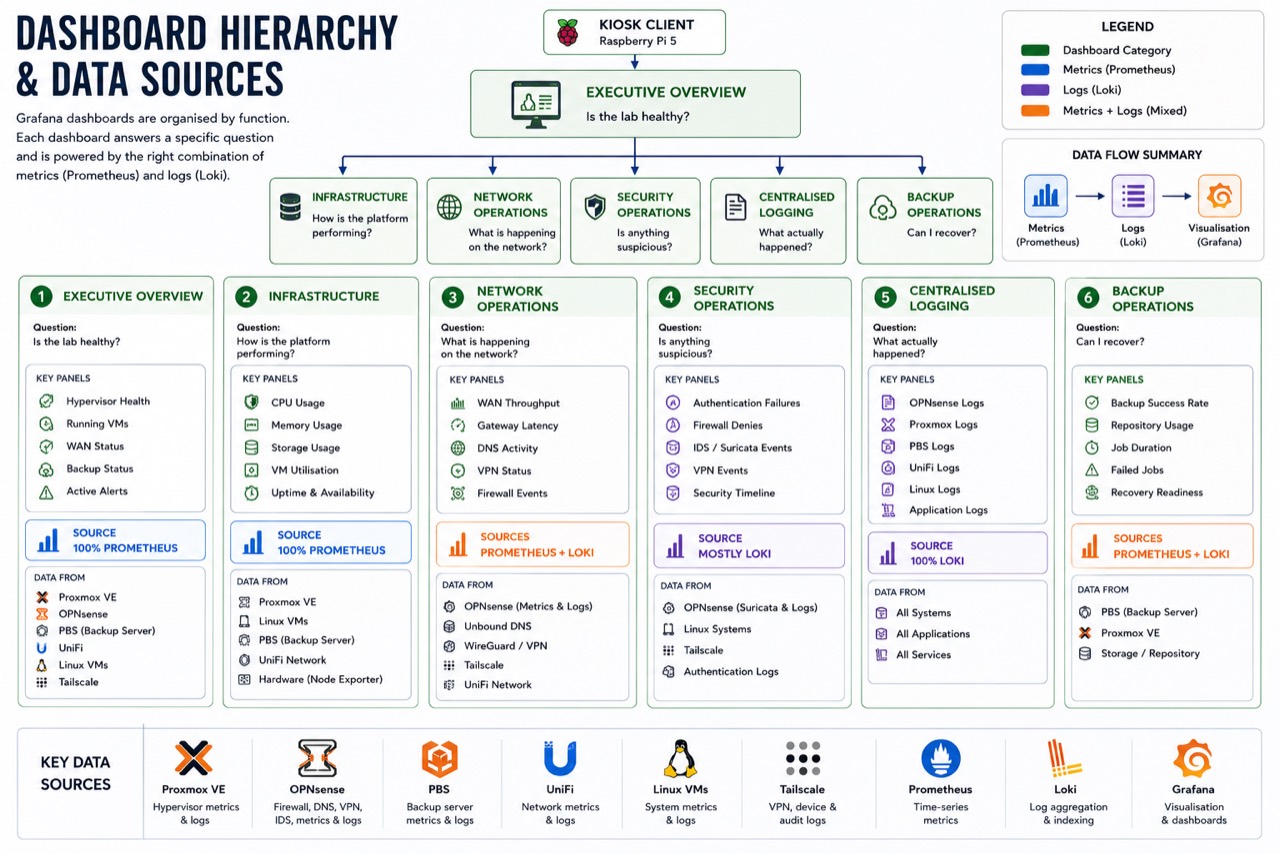
Figure 4: The six dashboards at a glance. Each answers one operational question and is powered by the appropriate mix of Prometheus metrics and Loki logs.
Dashboard 1: Executive Overview
The executive overview answers the simplest question: is the environment healthy?
It is designed to be understood in under five seconds. The panels cover hypervisor health, running virtual machines, WAN status, backup status, and active alerts. Most of this data comes from Prometheus via Proxmox, OPNsense, PBS, and alerting rules.
The backup panel is probably the most important part of the whole dashboard. A lab can tolerate a lot of inconvenience, but a failed backup chain changes the risk profile immediately.
Dashboard 2: Infrastructure
The infrastructure dashboard answers: how is the platform performing?
This view is almost entirely metric-driven. It tracks hypervisor CPU and memory, storage consumption, VM resource usage, and VM availability. The purpose is to spot resource pressure before it becomes a user-visible problem, especially memory pressure, datastore growth, or a guest workload becoming unexpectedly expensive.
Dashboard 3: Network Operations
The network operations dashboard answers: what is happening on the network?
This one combines Prometheus and Loki. Prometheus handles throughput, gateway latency, DNS activity, and VPN status. Loki adds the event view: firewall denies, rule hits, blocked destinations, and other network events that are easier to understand as logs than as graphs.
The distinction matters. Throughput tells me how busy the network is. Firewall logs tell me what the network is doing.
Dashboard 4: Security Operations
The security dashboard answers: is anything behaving unexpectedly?
Most of this view is event-based, so it leans heavily on Loki. It brings together authentication failures, firewall denies, VPN events, IDS or IPS events, and a security timeline. The goal is not to turn the homelab into a miniature SOC, but to make suspicious activity visible without needing to go hunting through separate log files.
Dashboard 5: Centralised Logging
The centralised logging dashboard answers: what actually happened?
This is the investigation view rather than the glanceable monitoring view. It pulls together OPNsense logs, Proxmox logs, Linux logs, and application logs. If something breaks, this is where I can move from a symptom to a sequence of events.
Dashboard 6: Backup Operations
The backup operations dashboard answers: can I recover if something fails?
It combines Prometheus metrics with Loki investigation panels. Prometheus tracks backup success rate, duration, repository usage, and historical trends. Loki provides the details when a job fails: errors, warnings, and PBS log context.
The useful question is not simply “did the last job run?” It is whether the environment is actually recoverable if the hypervisor fails right now.
Conclusion
The most valuable outcome of this project was not the dashboards themselves. It was the shift from reactive administration to continuous awareness.
The infrastructure no longer waits for me to check it. Prometheus provides state, Loki provides context, Grafana turns both into something readable, PULSE collects and stores the telemetry, and the Raspberry Pi presents it in the rack.
Together, those pieces turn a collection of servers, virtual machines, and services into an environment that can be understood at a glance. For a homelab, that is a surprisingly large quality-of-life improvement.